> ## Documentation Index
> Fetch the complete documentation index at: https://docs.mathfi.ai/llms.txt
> Use this file to discover all available pages before exploring further.
# Data analysis
> See what is in a dataset before you train: column types, missing values, distributions and the balance of the target.
In the console this view is called Data Visualiser.
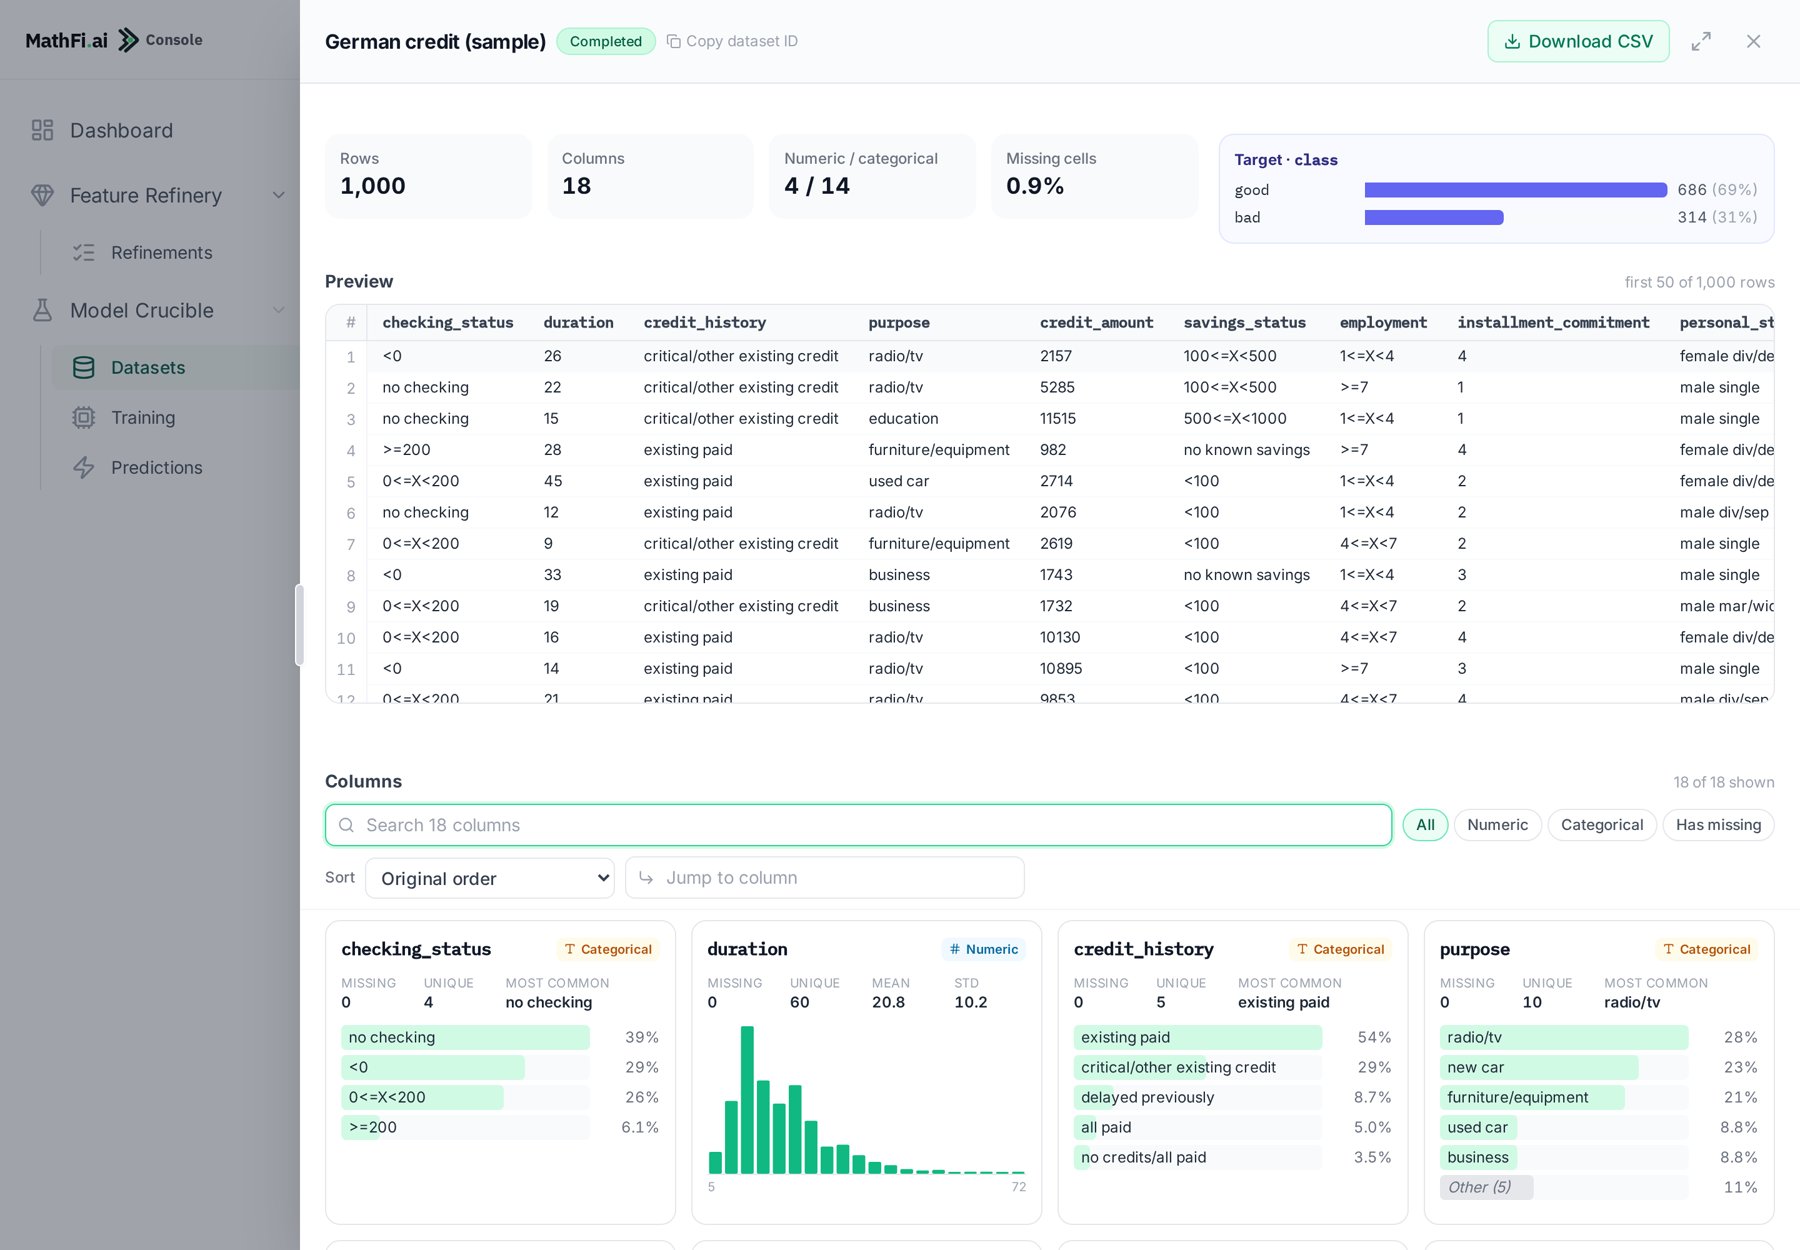
When you upload a dataset, the console profiles it. You see every column, how much of it is
missing and how the values are spread, before you start Feature Refinery or Model Crucible.
## Open it
In the console, go to **Datasets** and click **View details** on a dataset. The Data Visualiser is
the main part of the panel. It shows only when the dataset has a profile.
 ## What you see
| Part | What it shows |
| - | - |
| Summary | Rows, columns, how many are numeric and how many categorical, and the share of missing cells in the whole file. |
| Target | If the dataset has a target column: the rows in each class, as a count and as a percentage. |
| Preview | The first 50 rows of your data. For files with more than 50 columns, the first 50 columns. |
| Columns | One card for each column. |
Above the cards you can search by column name, filter (**All**, **Numeric**, **Categorical**,
**Has missing**), sort, and jump to a column by name.
## Read a column card
## What you see
| Part | What it shows |
| - | - |
| Summary | Rows, columns, how many are numeric and how many categorical, and the share of missing cells in the whole file. |
| Target | If the dataset has a target column: the rows in each class, as a count and as a percentage. |
| Preview | The first 50 rows of your data. For files with more than 50 columns, the first 50 columns. |
| Columns | One card for each column. |
Above the cards you can search by column name, filter (**All**, **Numeric**, **Categorical**,
**Has missing**), sort, and jump to a column by name.
## Read a column card
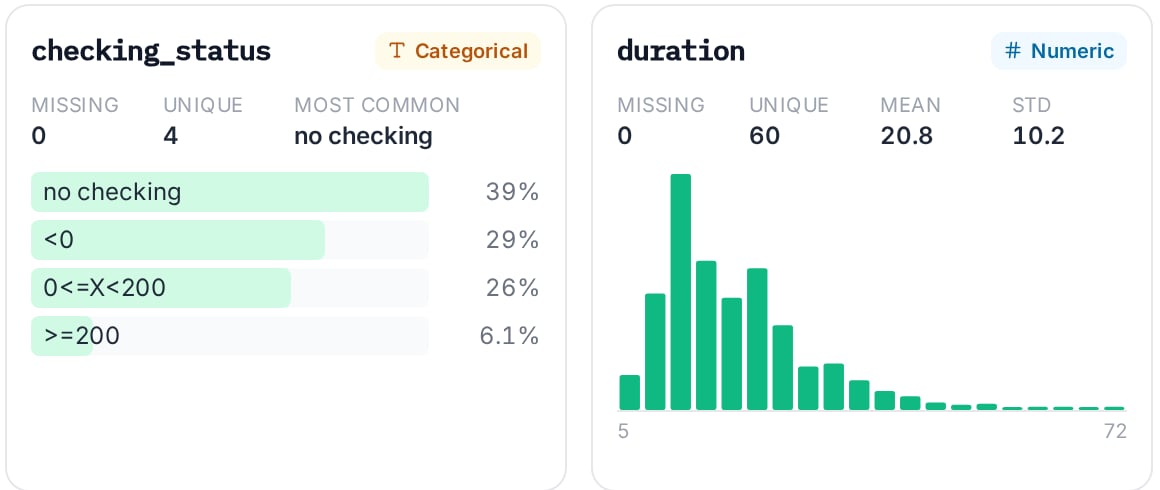 Every card shows the column name, its type, **Missing** (the share of empty rows, in amber when it
is not zero) and **Unique** (the number of different values).
* **Numeric column.** **Mean**, **Std** (standard deviation) and a histogram. The two numbers under
the histogram are the lowest and highest value.
* **Categorical column.** **Most common** value and a bar for each of the top values, with its
share of rows. Values that are not in the top group are added together as **Other**.
## Read the target
Every card shows the column name, its type, **Missing** (the share of empty rows, in amber when it
is not zero) and **Unique** (the number of different values).
* **Numeric column.** **Mean**, **Std** (standard deviation) and a histogram. The two numbers under
the histogram are the lowest and highest value.
* **Categorical column.** **Most common** value and a bar for each of the top values, with its
share of rows. Values that are not in the top group are added together as **Other**.
## Read the target
 The target card shows how many rows each class has. A class with only a few per cent of the rows
is a rare class. The model has fewer examples to learn from, so check it first.
## Check before you train
1. **Target.** Is it the column you want to predict? Is each class there, with enough rows? Aim
for at least 25 labelled rows in the smallest class. See [Input data](/guides/input-csv-creation).
2. **Missing values.** Use **Has missing** to list the columns with gaps. A column that is mostly
empty rarely helps a model.
3. **Types.** A column of numbers that shows as categorical, or the reverse, often means a bad
value in the file, such as text in a number column.
4. **Distributions.** Look for one value that fills most of a column, and for a long tail of very
high values. Decide if they are real or errors.
5. **Preview.** Check that the rows look like the file you meant to upload.
If you find a problem, fix the CSV and upload it again.
## Limits
* The preview shows the first 50 rows, and at most the first 50 columns. The column cards cover
every column.
* A dataset with more than about 200 columns can fail to build, so it has no profile. This is a
known issue.
* Column limits for each product are on [Input data](/guides/input-csv-creation).
* The profile describes the file you uploaded. It does not say which columns will help the model.
Feature Refinery does that.
This documentation is built and hosted on [Mintlify](https://mintlify.com), a developer documentation platform.
The target card shows how many rows each class has. A class with only a few per cent of the rows
is a rare class. The model has fewer examples to learn from, so check it first.
## Check before you train
1. **Target.** Is it the column you want to predict? Is each class there, with enough rows? Aim
for at least 25 labelled rows in the smallest class. See [Input data](/guides/input-csv-creation).
2. **Missing values.** Use **Has missing** to list the columns with gaps. A column that is mostly
empty rarely helps a model.
3. **Types.** A column of numbers that shows as categorical, or the reverse, often means a bad
value in the file, such as text in a number column.
4. **Distributions.** Look for one value that fills most of a column, and for a long tail of very
high values. Decide if they are real or errors.
5. **Preview.** Check that the rows look like the file you meant to upload.
If you find a problem, fix the CSV and upload it again.
## Limits
* The preview shows the first 50 rows, and at most the first 50 columns. The column cards cover
every column.
* A dataset with more than about 200 columns can fail to build, so it has no profile. This is a
known issue.
* Column limits for each product are on [Input data](/guides/input-csv-creation).
* The profile describes the file you uploaded. It does not say which columns will help the model.
Feature Refinery does that.
This documentation is built and hosted on [Mintlify](https://mintlify.com), a developer documentation platform.