> ## Documentation Index
> Fetch the complete documentation index at: https://docs.mathfi.ai/llms.txt
> Use this file to discover all available pages before exploring further.
# Getting started
> Get started with MathFi.ai. Create your first dataset, train a model, and run predictions in under an hour.
### Overview
MathFi.ai is a predictive AI toolkit that allows you to easily turn your tabular, labelled data into actionable predictions on new, unseen data.
For that, the following is needed:
* CSV file with tabular, labelled data
* CSV file with unseen data, same format of labelled data
From there, getting your first predictions is only few steps away:
* Access the platform
* Create a dataset by uploading your CSV file with labelled data
* Train a model from the created dataset
* Create a prediction that uses the model by uploading your unseen data CSV file
* Download your CSV unseen data file populated with results
In this page you can:
* [Follow a step by step explanation](#examine-sample-csv-data) with sample dataset
* Watch a [video walkthrough](#video-walkthrough-for-parkinson-diagnosis-data)
* Find out [next steps](#where-to-go-from-here) to get the maximum from MathFi.ai platform
Both UI dashboard and API (`curl` commands) are provided. Consult the [glossary](/glossary) for key metrics and terms used.
### Examine sample CSV data
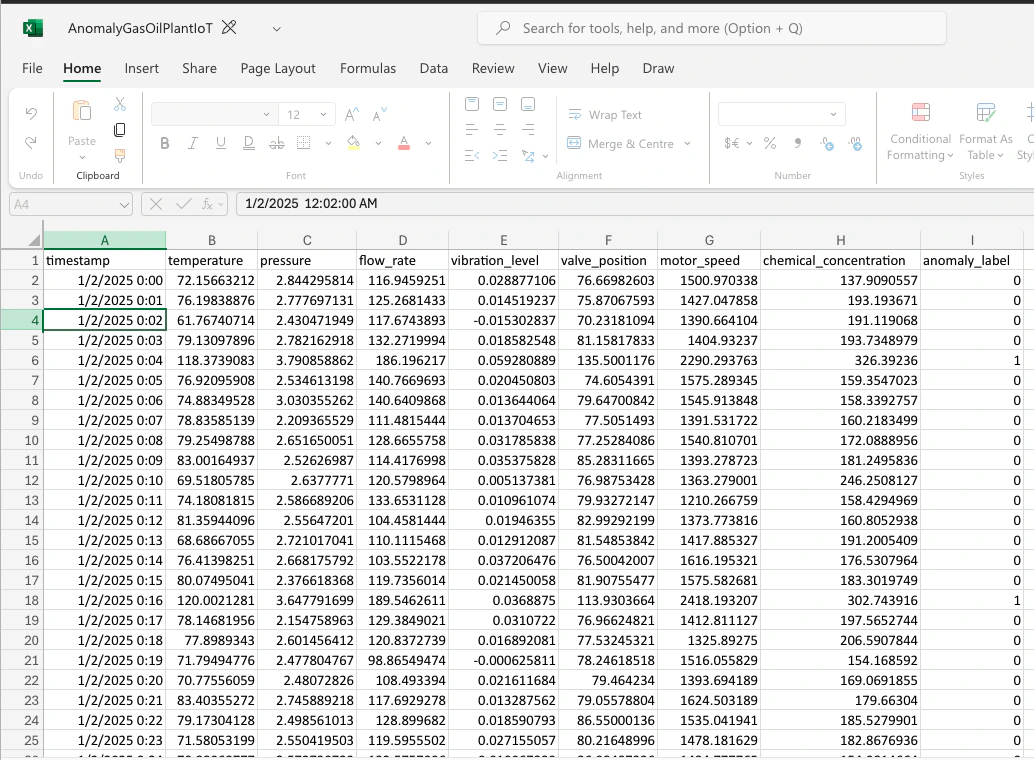
To fully understand how CSV should be prepared for this platform, follow [the input CSV creation guide](/guides/input-csv-creation). But for convenience, a couple pre-created labelled and blind CSV files are provided.
This sample data represents a set of readings from IoT devices present in a oil plant, aimed at predicting failure in key infrastructure.
* [CSV file with labelled data](/files/dataset-anomaly-gas-oil-plant.csv)
* [Blind CSV with unseen and unlabeled data](/files/blind-anomaly-gas-oil-plant.csv)
Predictions may return NaN probability values when the number of buckets is too low. To fix this, create a new dataset with more buckets and retrain. If NaN values persist, your training data may be insufficient. For this oil/gas plant example, using the default 20 buckets produces NaN values — increase to 65-100 buckets to resolve.
Key considerations:
* The `timestamp` acts as the unique `ID`
* The relevant features are the columns `temperature`, `flow_rate`, `vibration_level`, `valve_position`, `motor_speed`, `chemical_concentration`
* The outcome (binary classification for this example) is coded in the `anomaly_label` column (`0=no anomaly`, `1=anomaly`)
More data and use cases can be explored in depth in the [Use cases](/use-cases/healthcare) section.
### Access the platform
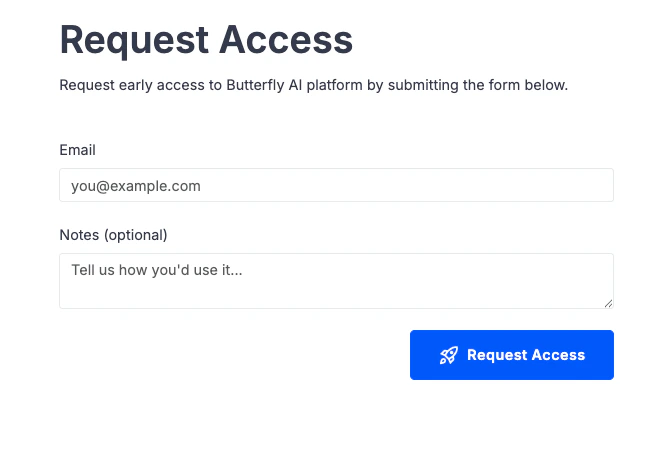
First of all, [request access to MathFi.ai](/get-access).
Once the form is submitted, you should shortly receive an email with your credentials. These credentials work for both the `Dashboard` and `REST API`.
The **MathFi.ai Dashboard** is a simple web application that allows you to upload your CSV with sample data, train a model and run predictions on new, unseen data.
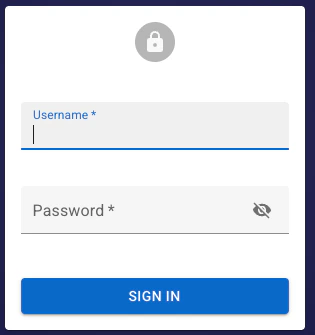
Use the link and provided credentials to log into the platform
After successful login, the following page should appear:
To access via API, use the provided links and credentials to login. The following are `curl` commands that use the endpoints fully described in the [API Reference](/developers/api-overview).
To login:
```bash theme={null}
curl --location 'https://{baseUrl}/api/login' \
--header 'Content-Type: application/json' \
--data-raw '{ "username": "youremail@email.com", "password": ""}'
```
the response should look like this:
```json theme={null}
{
"access_token": "",
"token_type": "Bearer",
"expires_in": 3600,
"username": ""
}
```
The returned `access_token` has 1h expiration and needs to be passed into every request. More details in [API Reference](/developers/api-overview).
### Create your first dataset
To get started, let's create a dataset from the [sample labelled CSV file](/files/dataset-anomaly-gas-oil-plant.csv)
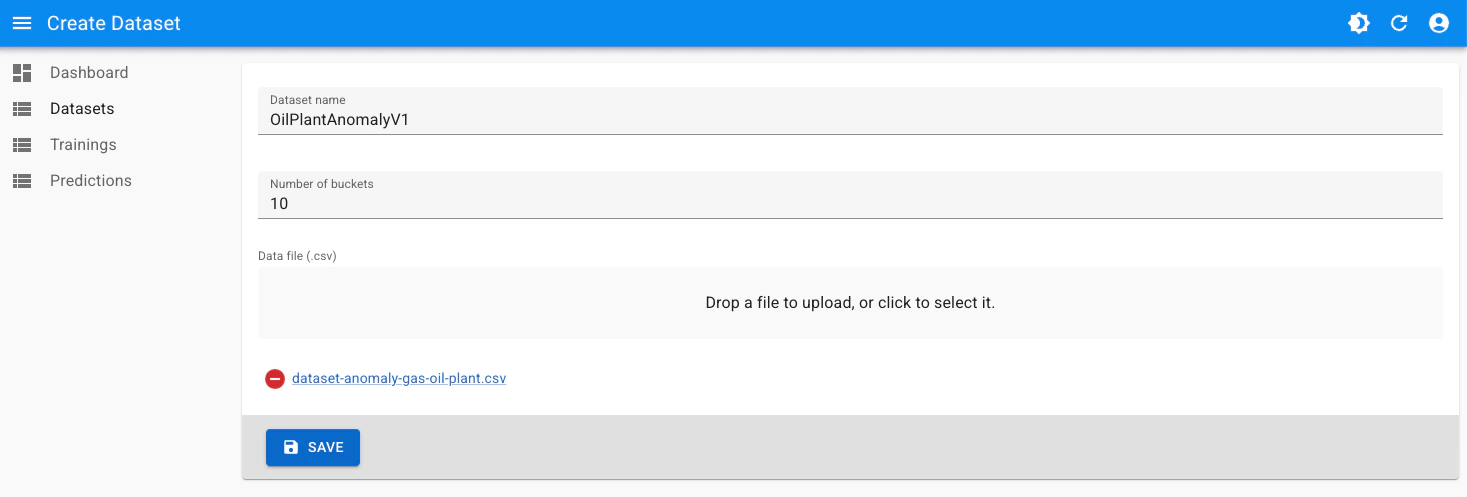
Select `Datasets` from the side menu, then `Create` button on right hand side. Then populate the form:
* `Dataset name`: set a descriptive name, must be unique across the platform
* `Number of buckets`: set it as `10` for this dataset. This is one of the hyperparameters that can be later modified to enhance model performance. More details on [Hyperparameter tuning](/guides/hyperparameter-tuning).
Click `Save` and wait for the dataset to finish processing.
Once the dataset is in `COMPLETED` status, it's ready for training.
Creating a `Dataset` using the API is done as 2-step process:
1. Create an empty `Dataset`
2. Use the **signed URL** returned from the previous step to add the labelled CSV data
#### Create an empty dataset
To create an empty dataset using the API:
```bash theme={null}
curl --location 'https://{baseUrl}/api/v1/datasets' \
--header 'Content-Type: application/json' \
--header 'Accept: application/json' \
--header 'Authorization: Bearer {token}' \
--data '{
"datasetName": "OilPlantAnomalyV1",
"numberOfBuckets": 10
}'
```
the response should look like this:
```json theme={null}
{
"datasetKey": "4223df90-0c31-4abf-a0e8-339b5c79f7c7",
"numberOfBuckets": 10,
"status": "PENDING",
"datasetCreationProgressUrl": "https://{baseUrl}/api/v1/datasets/4223df90-0c31-4abf-a0e8-339b5c79f7c7",
"datasetUploadInfo": {
"uploadUrl": "https://storage.googleapis.com/...",
"extraHeaders": "X-Goog-Content-Length-Range:10,534773760"
}
}
```
The important parts of the response for the next step are:
* `datasetUploadInfo`, `uploadUrl` and `extraHeaders` to craft the HTTP upload request
* This `uploadUrl` is valid for 1h before it expires
* `datasetCreationProgressUrl`: to poll the dataset creation for progress
#### Add labelled CSV data
In order to upload the CSV data against the newly created dataset, a `curl` command like this can be used:
```bash theme={null}
curl -i -XPUT '{uploadUrl}' \
--header 'X-Goog-Content-Length-Range: 10,534773760' \
--header 'Content-Type: text/csv' \
--header 'Authorization: Bearer {token}' \
--data-binary '@/path/to/dataset-anomaly-gas-oil-plant.csv'
```
Finally, check processing progress for the newly created dataset by polling the `datasetCreationProgressUrl`:
```bash theme={null}
curl --location 'https://{baseUrl}/api/v1/datasets/4223df90-0c31-4abf-a0e8-339b5c79f7c7' \
--header 'Accept: application/json' \
--header 'Authorization: Bearer {token}'
```
```json theme={null}
{
"datasetKey": "8223df90-0c31-4abf-a0e8-339b5c79f7c7",
"datasetName": "OilPlantAnomalyV100012",
"status": "COMPLETED",
"createdOn": "2025-09-28T18:47:24Z",
"numberOfBuckets": 10
}
```
For detailed information on these commands explore our [API recipes](/developers/api-recipes).
### Train a model
Once the dataset has finished processing (reached `COMPLETED` status), it's time to train the first model from it.
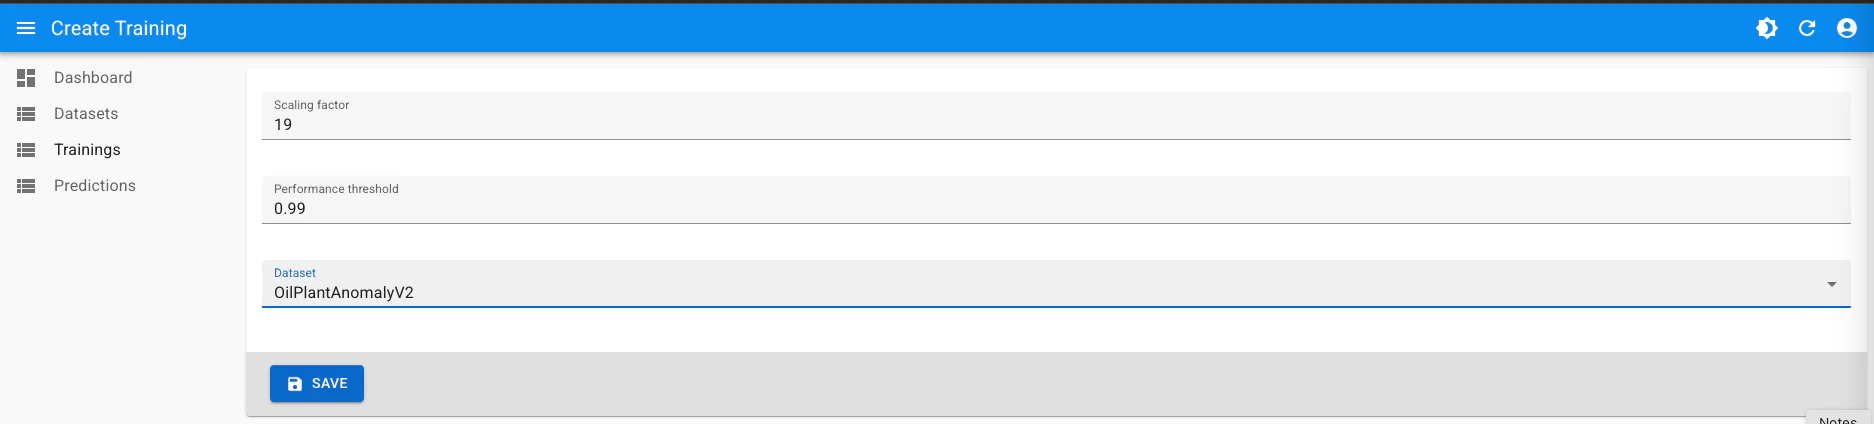
Choose `Trainings` from the sidebar, then click `Create` button. Fill the form with the following:
* **Scaling Factor**: set it to `19`. This is one of the key training hyperparameters. Full details are present in the [Training guide](/guides/training-guide) and [Hyperparameter tuning](/guides/hyperparameter-tuning) guide.
* **Performance threshold**: set it to `0.99`. This is another training hyperparameter, representing the desired prediction accuracy (`99%`)
* **Dataset**: Select the newly created dataset
The training process starts, showing the real time performance of the **4 proprietary training algorithms** of MathFi.ai:
It should take no more than 10 minutes for this dataset training to complete and get the initial *Champion model*:
Training via the API can be started with the following command:
```bash theme={null}
curl --location 'https://{baseUrl}/api/v1/training/datasets/8223df90-0c31-4abf-a0e8-339b5c79f7c7' \
--header 'Content-Type: application/json' \
--header 'Accept: application/json' \
--header 'Authorization: Bearer {token}' \
--data '{
"performanceThreshold": 0.99,
"scalingFactor": 19
}'
```
```json theme={null}
{
"trainingJobKey": "3f856c87-ceb2-4988-ad2b-60719741c38b",
"datasetKey": "8223df90-0c31-4abf-a0e8-339b5c79f7c7",
"status": "PENDING",
"trainingJobProgressUrl": "https://{baseUrl}/api/v1/training/3f856c87-ceb2-4988-ad2b-60719741c38b"
}
```
A training job has been created. Poll the `trainingJobProgressUrl` for basic progress, or append `/progress` for a detailed per-algorithm view:
```bash theme={null}
curl --location 'https://{baseUrl}/api/v1/training/3f856c87-ceb2-4988-ad2b-60719741c38b/progress' \
--header 'Accept: application/json' \
--header 'Authorization: Bearer {token}'
```
```json theme={null}
{
"status": "RUNNING",
"jobs": [
{
"trainingJobKey": "07e98a02-d052-4f99-a021-5f6d7e9c3977",
"algorithm": "BSEV02",
"status": "COMPLETED",
"latestPerformance": 0.9922231,
"recentPerformances": [0.9682258, 0.9402289, 0.98822355, 0.98622376, 0.9922231]
},
{
"trainingJobKey": "3928598b-abf3-427c-9453-802518a78637",
"algorithm": "BSEV01",
"status": "COMPLETED",
"latestPerformance": 0.9900011,
"recentPerformances": [0.98600155, 0.98800135, 0.98800135, 0.98800135, 0.9900011]
},
{
"trainingJobKey": "8464ce1c-cd47-47d0-ba70-b2f6ae71baf1",
"algorithm": "BFIF01",
"status": "RUNNING",
"latestPerformance": 0.90577775,
"recentPerformances": [0.89955556, 0.9035556, 0.90555555, 0.90566665, 0.90577775]
},
{
"trainingJobKey": "b3ea8b00-b9d6-4855-b365-e62e29e12d7f",
"algorithm": "BSIX01",
"status": "COMPLETED",
"latestPerformance": 0.9937771,
"recentPerformances": [0.97977555, 0.97777534, 0.97977555, 0.97977555, 0.9937771]
}
]
}
```
Eventually, the `COMPLETED` status should be reached, showing final performances and the created model `modelKey`:
```json theme={null}
{
"trainingJobKey": "3f856c87-ceb2-4988-ad2b-60719741c38b",
"datasetKey": "4223df90-0c31-4abf-a0e8-339b5c79f7c7",
"status": "COMPLETED",
"scalingFactor": 19,
"targetPerformance": 0.99,
"achievedPerformance": 0.98727316,
"trainingPerformance": 0.9937771,
"testPerformance": 0.9807692,
"modelKey": "4eea9572-66aa-446e-8b67-328409a56f8f"
}
```
At this point, a model exists with the following [training metrics](/glossary):
* *Overall achieved performance*: `0.997219`
* *Training performance*: `0.9934427`
* *Test performance*: `1.0000`
Each new training will override this model as long as `achievedPerformance` is greater than the existing one. This model can now be used to create any number of *Predictions* on unseen data.
Check the [Training guide](/guides/training-guide) for more details on the process.
### Obtain a prediction
Once a *model* with the desired performance has been successfully created from training, it can be used to run predictions on unseen and unlabelled data (inference) as many times as needed. For the sake of this guide [this blind CSV data](/files/blind-anomaly-gas-oil-plant.csv) is being used to try out prediction creation. This is going to be a *batch* prediction, in which each row represents a single, individual inference.
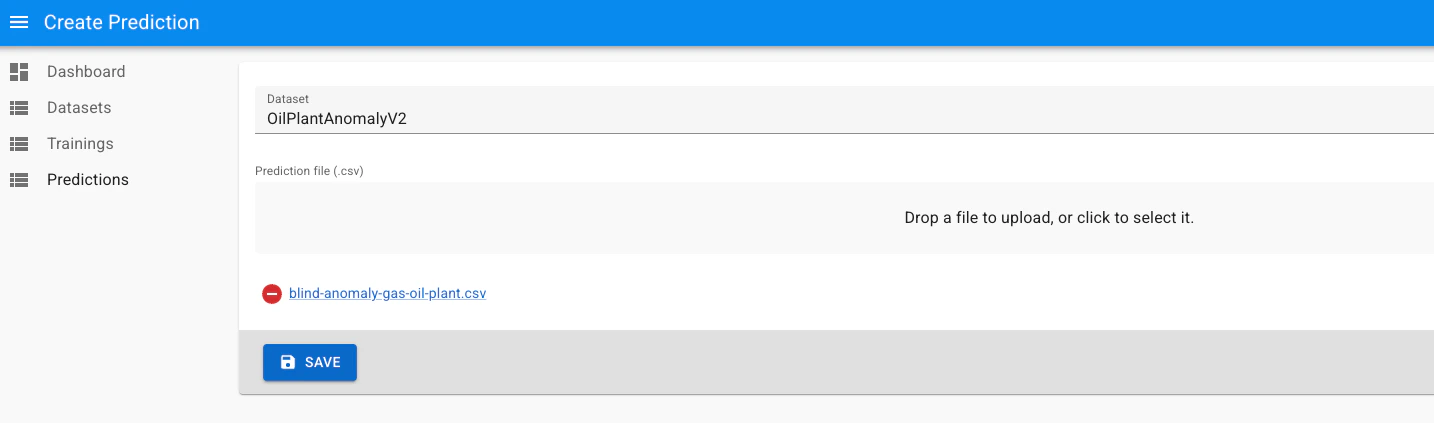
Select `Predictions` on the sidebar, then `Create`:
* Select the original dataset
* Upload the blind CSV
After few moments (depending on size), the prediction completes and the resulting CSV can be downloaded using the `Download` link:
To create a prediction using the API you'll need to provide the `modelKey` to use, the command looks like:
```bash theme={null}
curl --location 'https://{baseUrl}/api/v1/predictions/models/4eea9572-66aa-446e-8b67-328409a56f8f' \
--header 'Content-Type: text/csv' \
--header 'Accept: application/json' \
--header 'Authorization: Bearer {token}' \
--form '_file=@"/path/to/blind-anomaly-gas-oil-plant.csv"'
```
```json theme={null}
{
"predictionKey": "02588573-1d4f-4fcc-8985-f8aaabf09171",
"status": "PENDING",
"predictionCreationProgressUrl": "https://{baseUrl}/api/v1/predictions/02588573-1d4f-4fcc-8985-f8aaabf09171"
}
```
Check progress using `predictionCreationProgressUrl`:
```bash theme={null}
curl --location 'https://{baseUrl}/api/v1/predictions/02588573-1d4f-4fcc-8985-f8aaabf09171/progress' \
--header 'Accept: application/json' \
--header 'Authorization: {token}'
```
```json theme={null}
{
"status": "COMPLETED"
}
```
Download the result using the `predictionKey` and redirecting the output to a CSV file:
```bash theme={null}
curl --location 'https://{baseUrl}/api/v1/predictions/02588573-1d4f-4fcc-8985-f8aaabf09171/download' \
--header 'Content-Type: text/csv' \
--header 'Authorization: {token}' > predictionResult.csv
```
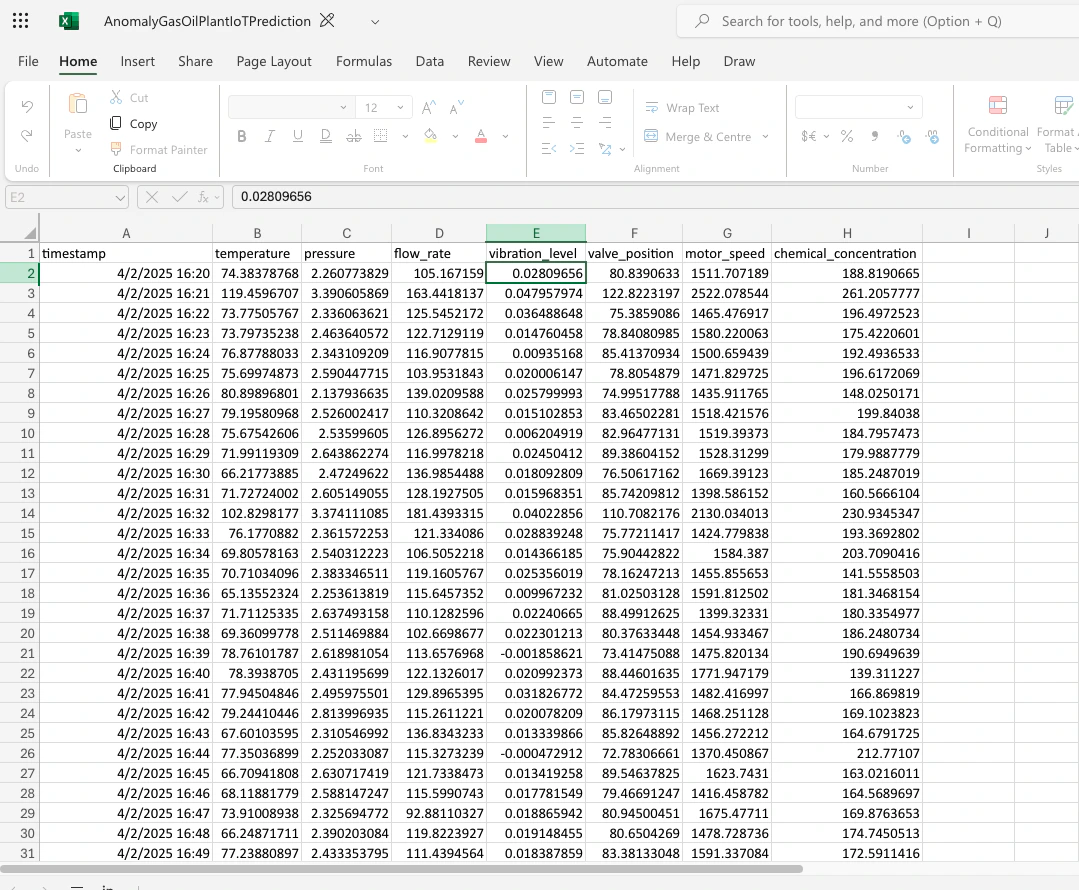
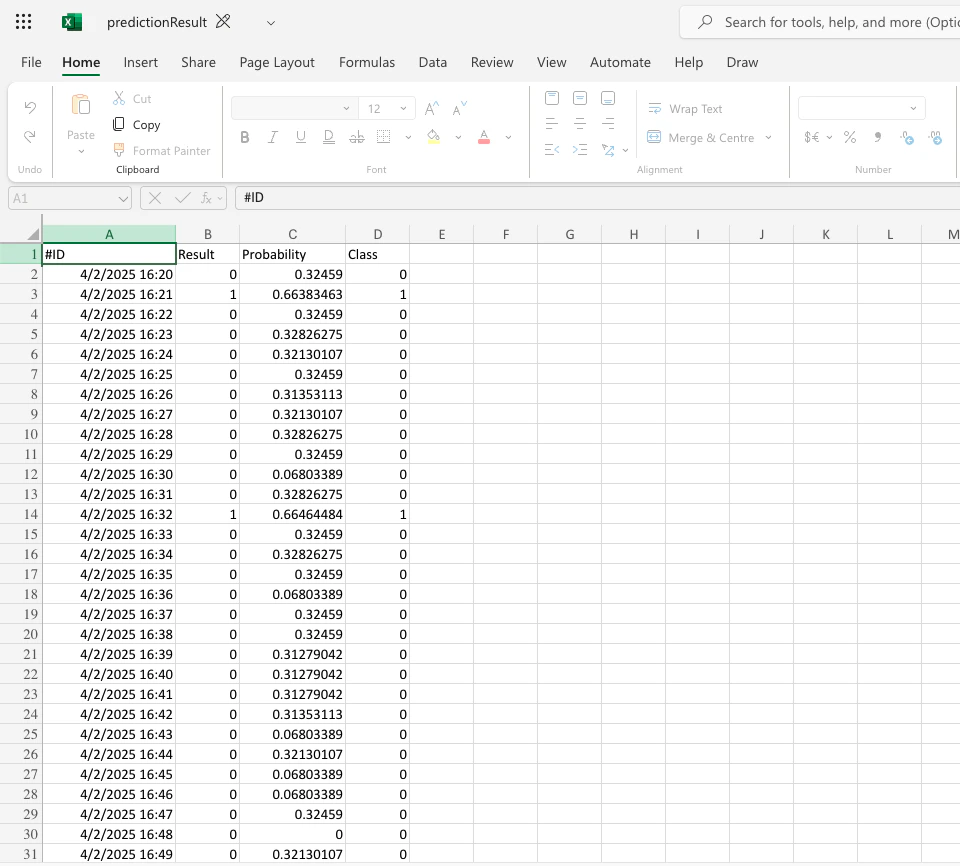
This is how the [prediction results](/files/blind-anomaly-gas-oil-plant-populated.csv) look like:
The `ID`s on the original blind file have been populated with a predicted label. Overall, this predicted label would be correct in `99%` of the cases.
### Video walkthrough for Parkinson diagnosis data
This is a video walkthrough outlining the step by step process to analyse Parkinson diagnosis data within MathFi.ai platform.
### Where to go from here
This guide has explored the key workflows within MathFi.ai platform and to get a first prediction. In a nutshell, that's what the platform is about: CSV with data --> training --> prediction on unseen data.
For binary predictions, the MathFi.ai Platform assigns a probability that reflects the model's confidence. A label is chosen if its probability is above (1) or below (0) 0.5. Values closer to 0 or 1 indicate higher certainty. The probability appears as a column in the prediction results file.
Next steps:
* Get in depth understanding of the dataset creation and training processes via the [Training guide](/guides/training-guide)
* Improve gradually the performance of the trained model via [Hyperparameter tuning](/guides/hyperparameter-tuning)
* Explore real life use cases in the [Use cases](/use-cases/healthcare) section
* Integrate MathFi.ai in your existing workflow [using the API](/developers/api-overview)

 Key considerations:
* The `timestamp` acts as the unique `ID`
* The relevant features are the columns `temperature`, `flow_rate`, `vibration_level`, `valve_position`, `motor_speed`, `chemical_concentration`
* The outcome (binary classification for this example) is coded in the `anomaly_label` column (`0=no anomaly`, `1=anomaly`)
More data and use cases can be explored in depth in the [Use cases](/use-cases/healthcare) section.
### Access the platform
First of all, [request access to MathFi.ai](/get-access).
Key considerations:
* The `timestamp` acts as the unique `ID`
* The relevant features are the columns `temperature`, `flow_rate`, `vibration_level`, `valve_position`, `motor_speed`, `chemical_concentration`
* The outcome (binary classification for this example) is coded in the `anomaly_label` column (`0=no anomaly`, `1=anomaly`)
More data and use cases can be explored in depth in the [Use cases](/use-cases/healthcare) section.
### Access the platform
First of all, [request access to MathFi.ai](/get-access).
 Once the form is submitted, you should shortly receive an email with your credentials. These credentials work for both the `Dashboard` and `REST API`.
 * `Dataset name`: set a descriptive name, must be unique across the platform
* `Number of buckets`: set it as `10` for this dataset. This is one of the hyperparameters that can be later modified to enhance model performance. More details on [Hyperparameter tuning](/guides/hyperparameter-tuning).
Click `Save` and wait for the dataset to finish processing.
* `Dataset name`: set a descriptive name, must be unique across the platform
* `Number of buckets`: set it as `10` for this dataset. This is one of the hyperparameters that can be later modified to enhance model performance. More details on [Hyperparameter tuning](/guides/hyperparameter-tuning).
Click `Save` and wait for the dataset to finish processing.
 Once the dataset is in `COMPLETED` status, it's ready for training.



 The `ID`s on the original blind file have been populated with a predicted label. Overall, this predicted label would be correct in `99%` of the cases.