> ## Documentation Index
> Fetch the complete documentation index at: https://docs.mathfi.ai/llms.txt
> Use this file to discover all available pages before exploring further.
# Agriculture crop classification
> Agriculture classification use case to predict crop or soil outcomes from structured field data with MathFi.ai.
### The problem: maximize yield of crops
Farmers primary goal is to maximize crop yield in each season. To achieve that farmers need to make a crucial decision to select the best crop depending on soil conditions such as the levels of nitrogen, phosphorous, potassium, and the pH value of the soil to ensure optimal growth and yield.
### The data
For this project, the goal is to develop a **multi-class classification model** using MathFi.ai Platform to predict the most suitable crop based on the provided features.
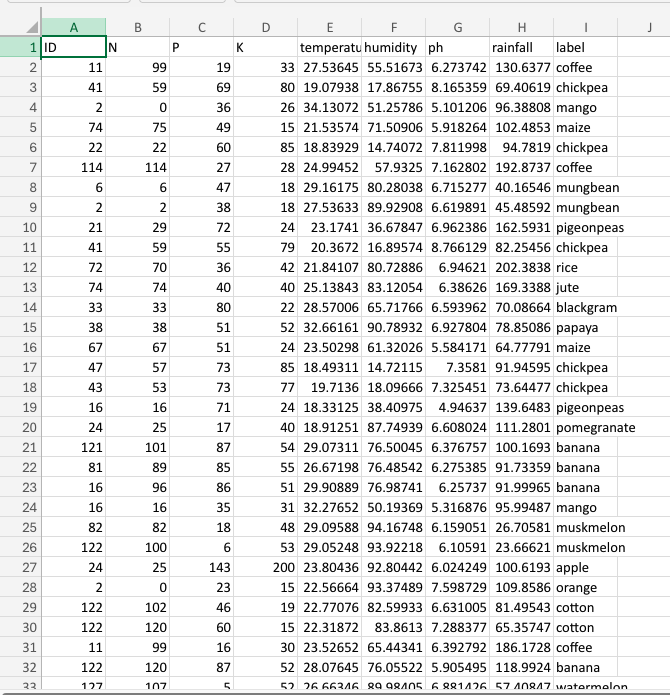
The present dataset (Crop.csv) includes the following features:
| Parameter | Units | Description |
| ------------- | --------------- | ---------------------------------------------------------- |
| `N` | % (ratio) | Nitrogen content ratio in the soil. |
| `P` | % (ratio) | Phosphorous content ratio in the soil. |
| `K` | % (ratio) | Potassium content ratio in the soil. |
| `ph` | 0–14 (unitless) | pH value (acidity/alkalinity) of the soil. |
| `temperature` | °C | Ambient/soil temperature measured in degrees Celsius. |
| `humidity` | % | Relative humidity. |
| `rainfall` | mm | Total rainfall (e.g., over the sampling period). |
| `label` | categorical | Target variable: crop label for the given soil conditions. |
### Dataset creation
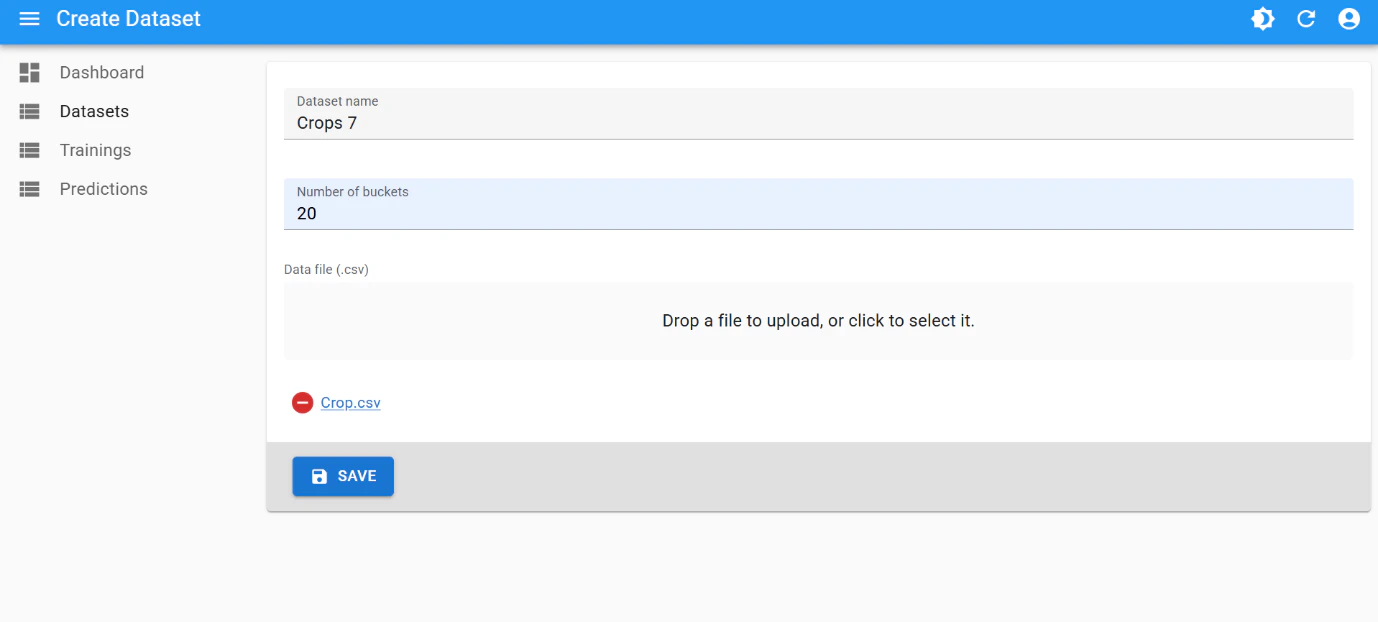
Use the following parameters for dataset creation:
* **number of buckets**: `20`
### Training
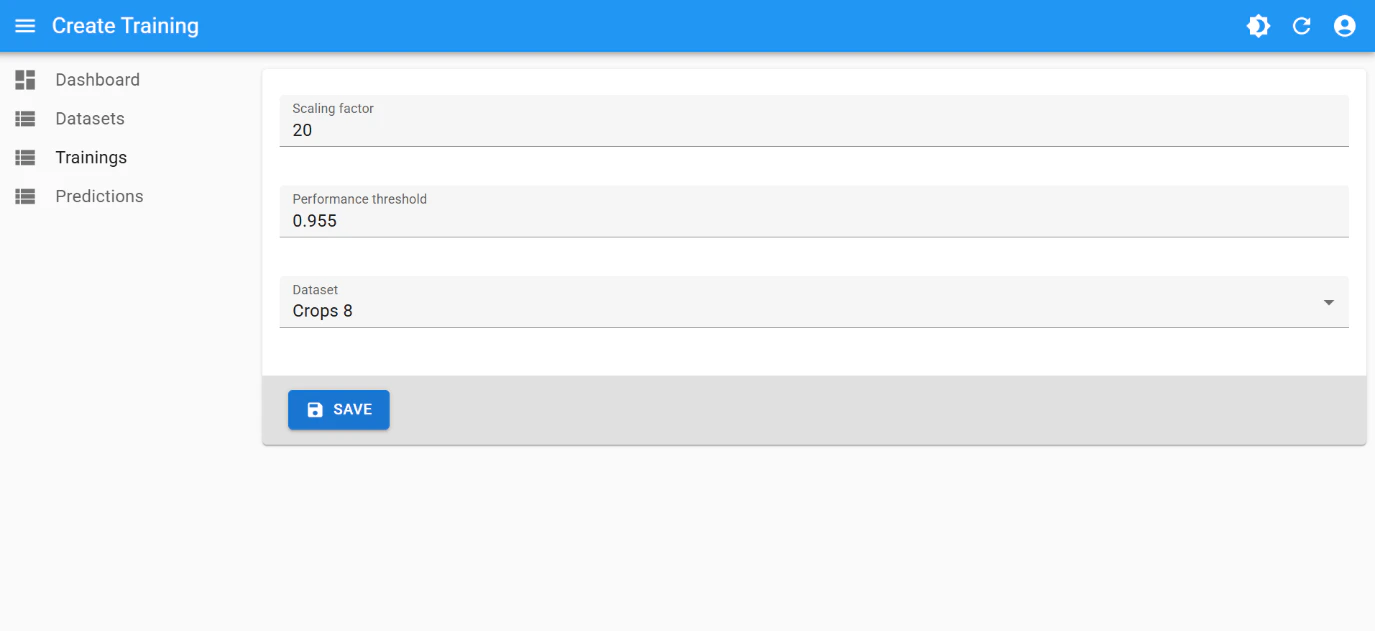
This is the best training attempt:
* **scaling factor**: `20`
* **performance threshold**: `0.955`
 which obtained maximum performance (`0.9491283` vs previous `0.9434465`)
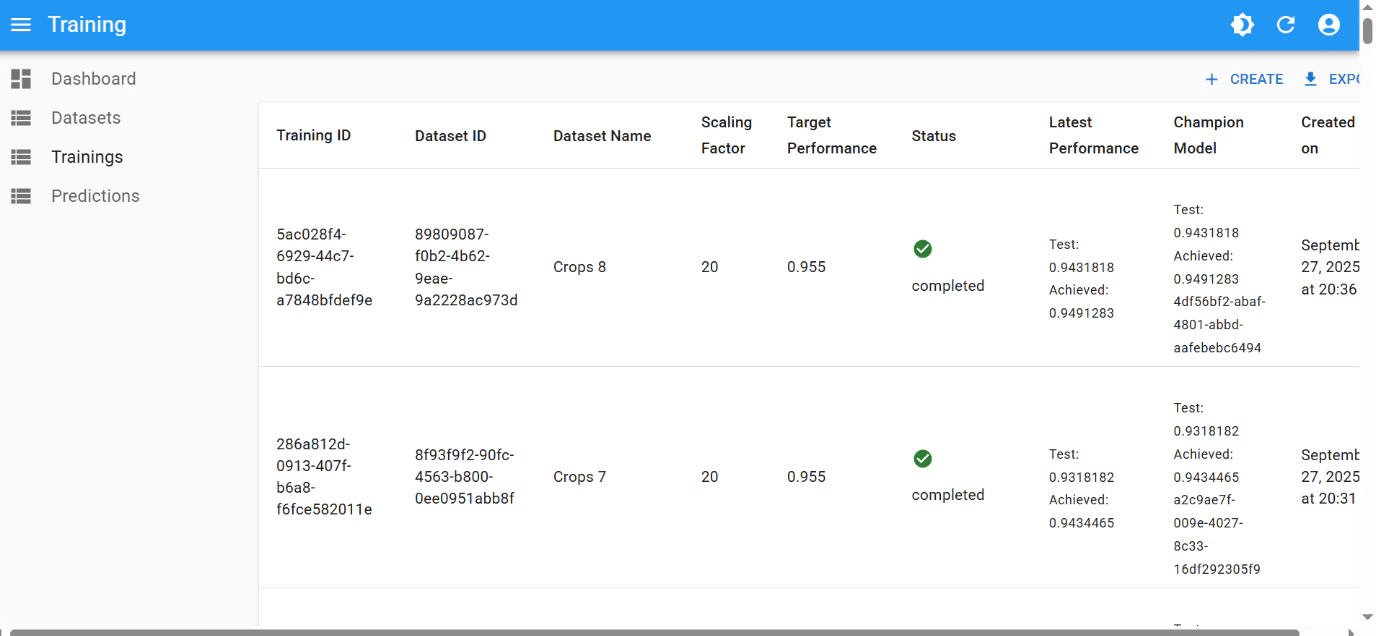
This good performance of `0.955` was achieved after few iterations of [hyperparameter tuning](/guides/hyperparameter-tuning):
| # | Number of Buckets | Scaling Factor | Performance Threshold |
| :-: | ----------------: | -------------: | --------------------: |
| 1 | 20 | 19 | 0.80 |
| 2 | 20 | 20 | 0.95 |
| 3 | 10 | 20 | 0.96 |
| 4 | 10 | 20 | 0.955 |
### Final result
Using this unseen unlabelled data
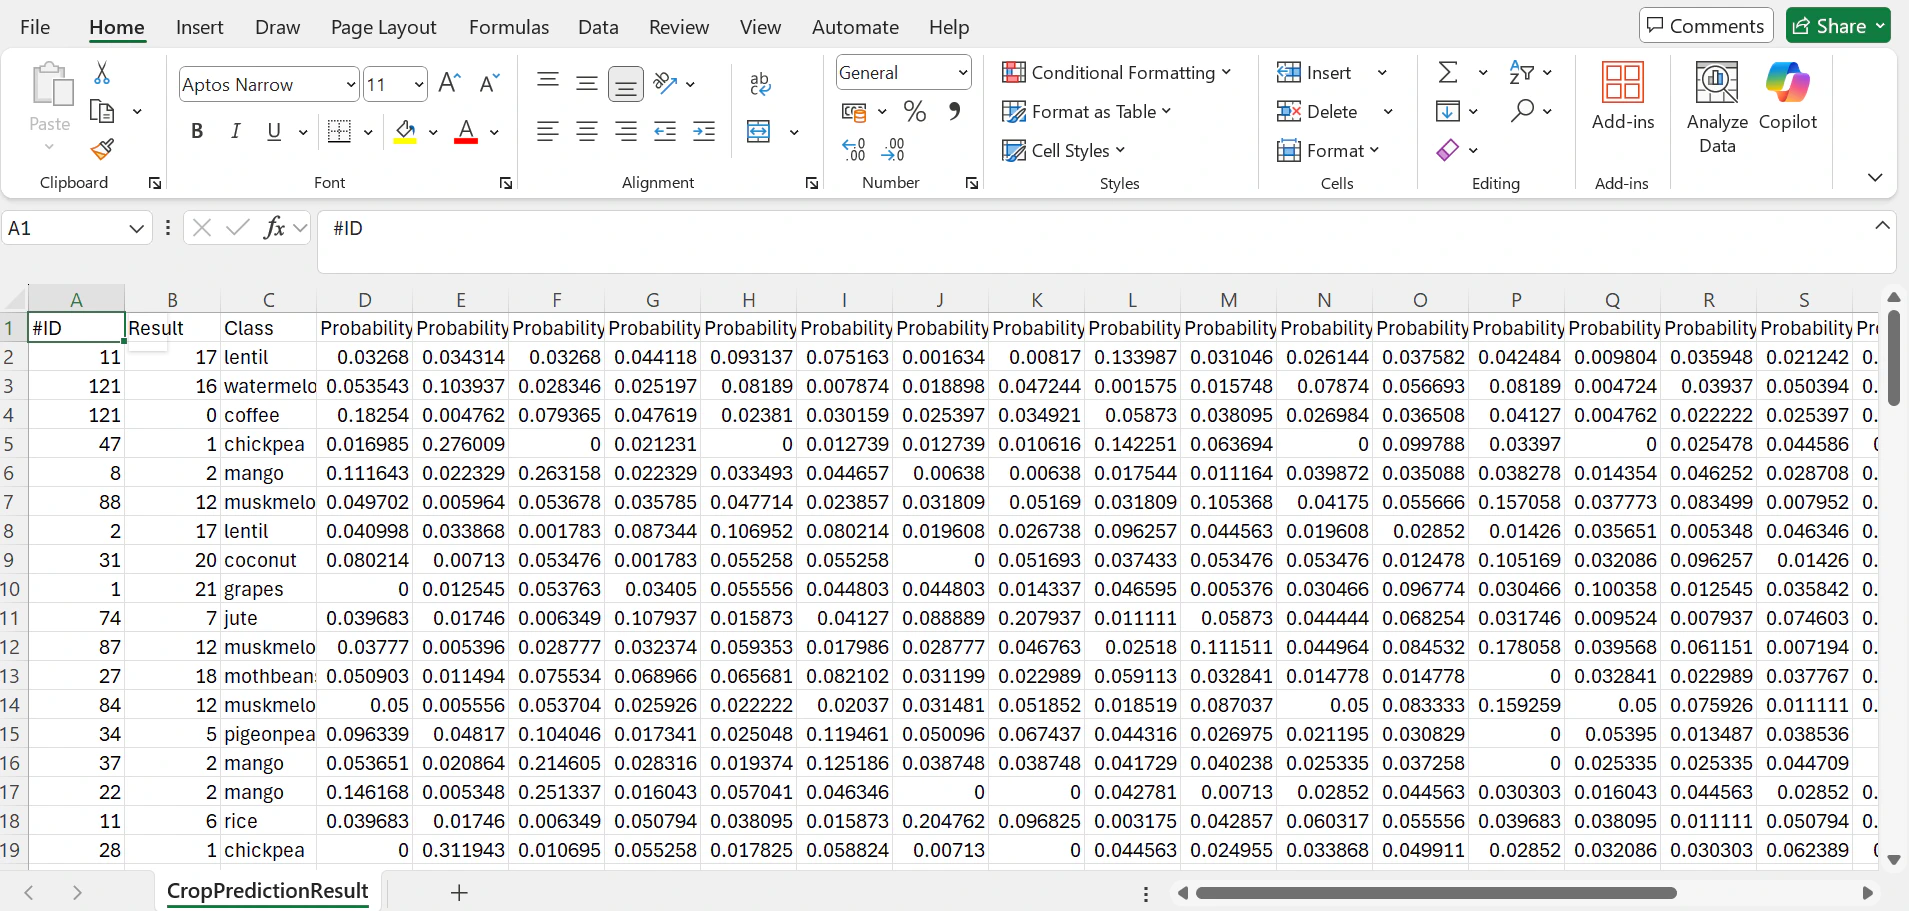
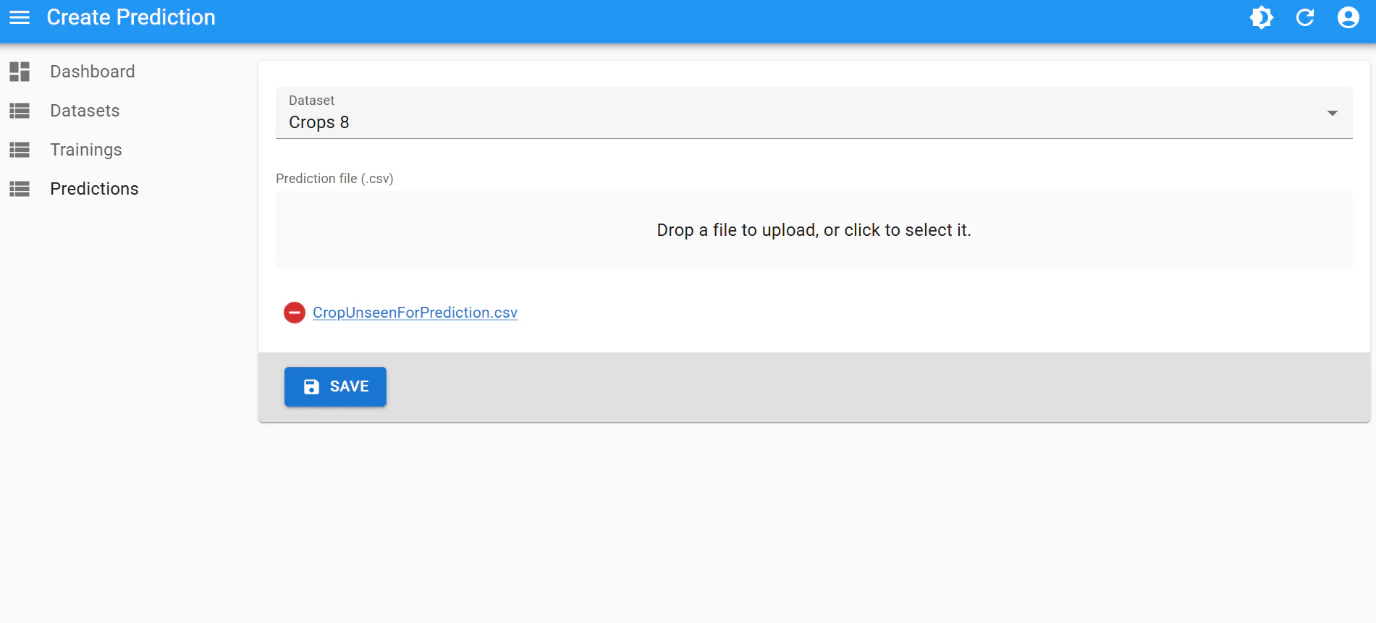 As this is a multi-class classification, a probability is assigned to each target label. In this case, `Probability1` belongs to the first label, `Probability2` belongs to the second label... the label order is established following their appearance order in the original training file.
For example, in the *Crops* training file used for this example, the `Probability18=lentil` as `lentil` is the 18th distinct label that appears in the file. The classification result is the label with the highest probability of all.
The resulting labelled CSV looks like this:
As this is a multi-class classification, a probability is assigned to each target label. In this case, `Probability1` belongs to the first label, `Probability2` belongs to the second label... the label order is established following their appearance order in the original training file.
For example, in the *Crops* training file used for this example, the `Probability18=lentil` as `lentil` is the 18th distinct label that appears in the file. The classification result is the label with the highest probability of all.
The resulting labelled CSV looks like this:
 ***
**Build this yourself** — Follow the [Quickstart](/quickstart) to run your first prediction, or go straight to [API Recipes](/developers/api-recipes) to integrate programmatically.
***
**Build this yourself** — Follow the [Quickstart](/quickstart) to run your first prediction, or go straight to [API Recipes](/developers/api-recipes) to integrate programmatically.