> ## Documentation Index
> Fetch the complete documentation index at: https://docs.mathfi.ai/llms.txt
> Use this file to discover all available pages before exploring further.
# Insurance claims prediction: imbalanced data
> Insurance claims prediction to classify claim outcomes on imbalanced data with MathFi.ai balanced-class learning.
### The problem: Predict if Medical Insurance applications are high risk
MathFi.ai can assist insurance companies decide if a medical insurance application is high risk. That will help these companies improve the accuracy of the applications approval process, while reducing the cost of insurance applications through automation and reduction of human error.
### The data
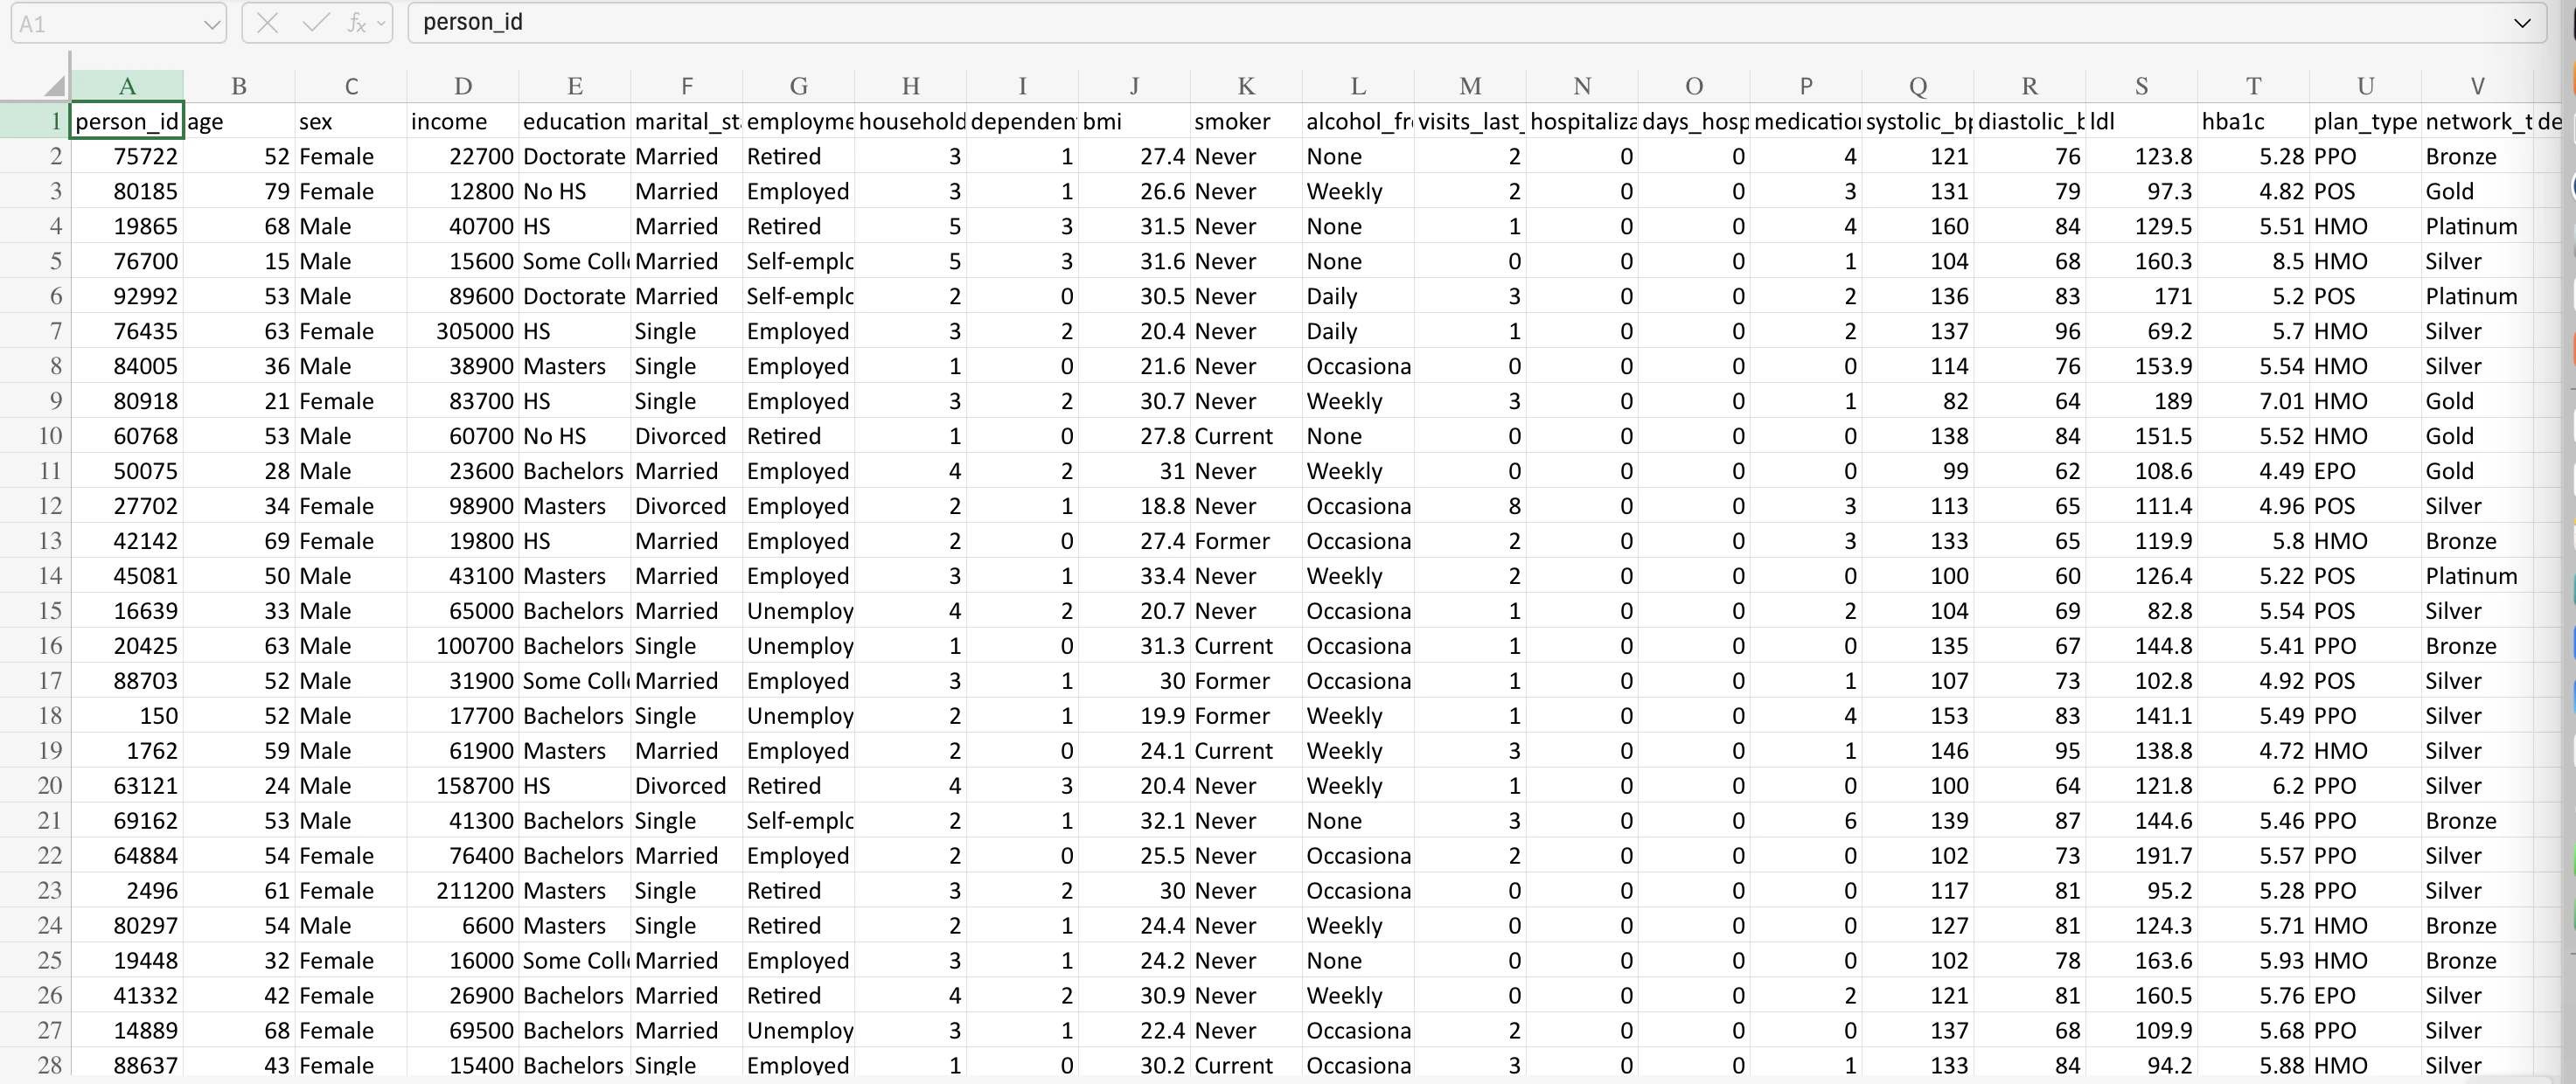
The base dataset used is (InsuranceClaim.csv).
It includes 98000 labelled medical insurance applications.
This dataset is the altered version of an original data which is available under a `CC0: Public Domain license` at [https://creativecommons.org/publicdomain/zero/1.0/](https://creativecommons.org/publicdomain/zero/1.0/)
##### First group of features: Demographics & Socioeconomic
* `person_id`
* `age`
* `sex`
* `region`
* `urban_rural`
* `income`
* `education`
* `marital_status`
* `employment_status`
* `household_size`
* `dependents`
##### Second group of features: Lifestyle & Habits
* `bmi`
* `smoker`
* `alcohol_freq`
* `exercise_frequency`
* `sleep_hours`
* `stress_level`
##### Third group of features: Health & Clinical
* `hypertension`
* `diabetes`
* `copd`
* `cardiovascular`
* `cancer_history`
* `kidney_disease`
* `liver_disease`
* `arthritis`
* `mental_health`
* `chronic_count`
* `systolic_bp`
* `diastolic_bp`
* `ldl`
* `hba1c`
##### Fourth group of features: Healthcare Utilization & Procedures
* `visits_last_year`
* `hospitalizations_last_3yrs`
* `days_hospitalized_last_3yrs`
* `medication_count`
* `proc_imaging`
* `proc_surgery`
* `proc_psycho`
* `proc_consult_count`
* `proc_lab`
* `had_major`
##### Fifth group of features: Insurance & Policy
* `plan_type`
* `network_tier`
* `deductible`
* `copay`
* `policy_term_years`
* `policy_changes_last_2yrs`
* `provider_quality`
##### Sixth group of features, Medical Costs & Claims:
* `annual_medical_cost`
* `annual_premium`
* `monthly_premium`
* `claims_count`
* `avg_claim_amount`
* `total_claims_paid`
##### Target of Prediction (Label):
`is_high_risk`
### Dataset creation
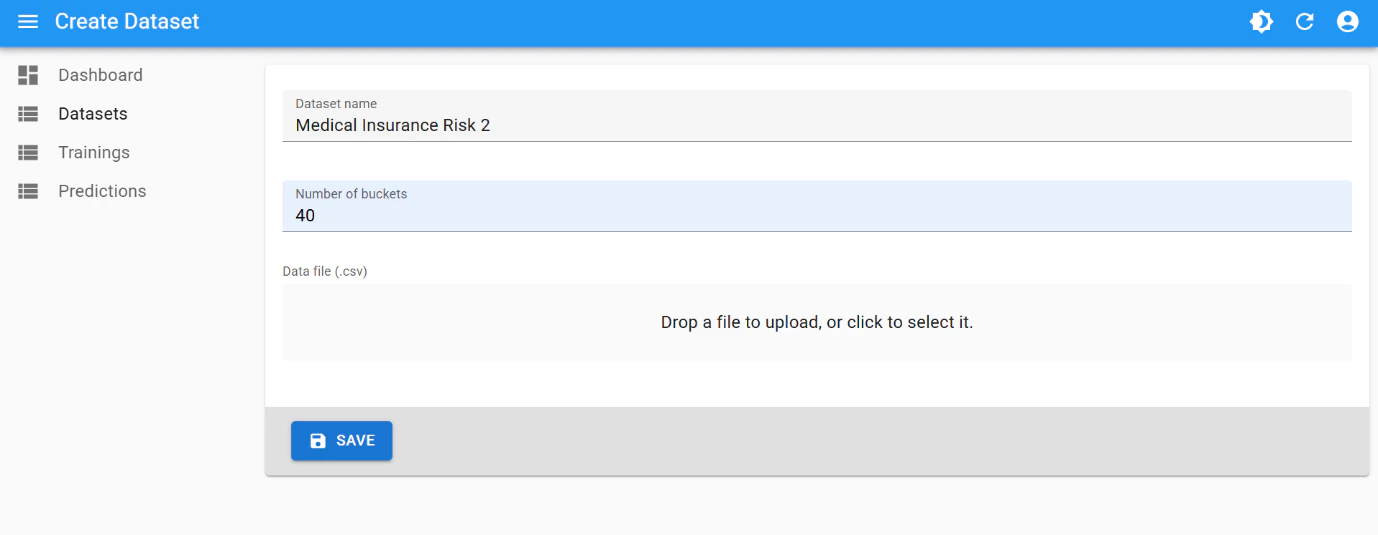
Use the following parameters for dataset creation:
* **number of buckets**: `40`
### Training
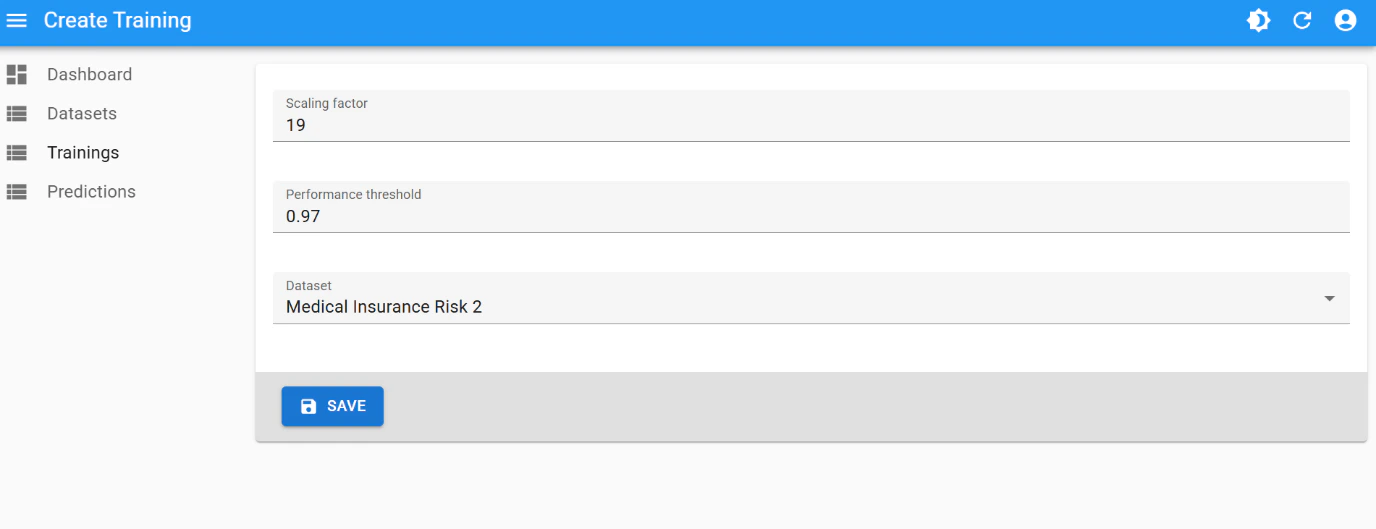
This is the best training attempt:
* **scaling factor**: `19`
* **performance threshold**: `0.97`
 And the created *champion model*:
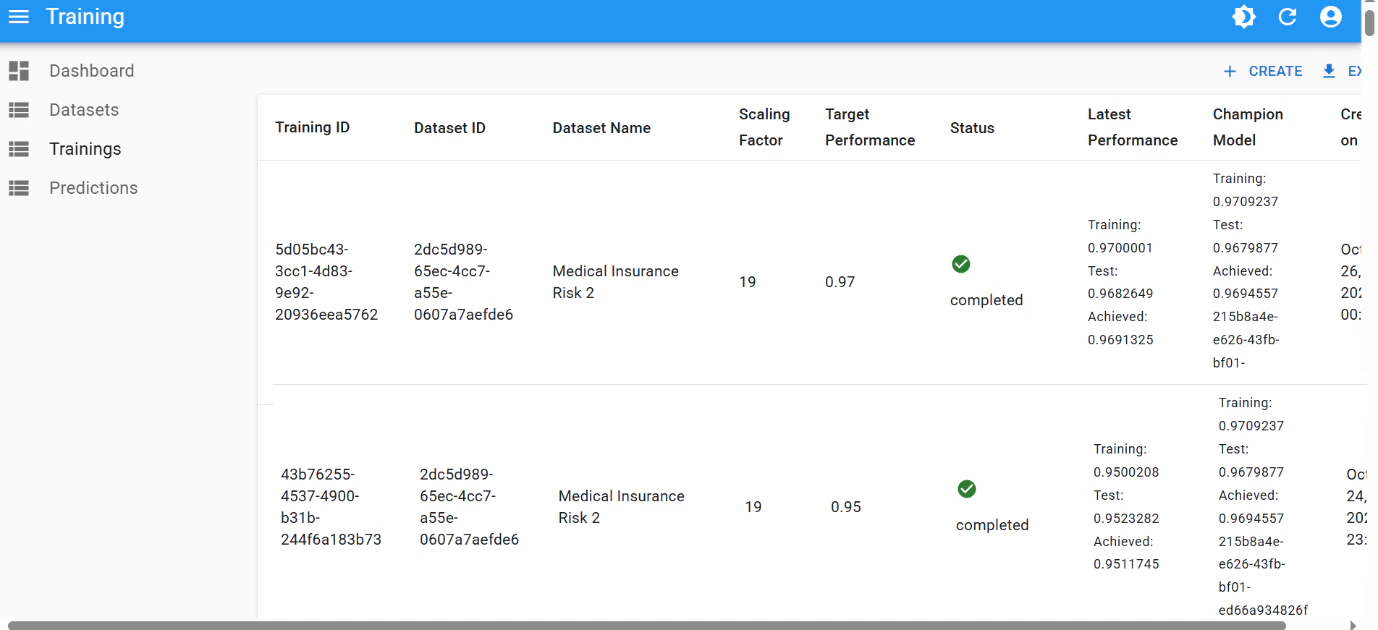
The final performance of `0.97` was achieved after few iterations of [hyperparameter tuning](/guides/hyperparameter-tuning):
| Number of Buckets | Scaling Factor | Performance Threshold |
| ----------------: | -------------: | --------------------: |
| 20 | 19 | 0.80 |
| 20 | 19 | 0.95 |
| 40 | 19 | 0.95 |
| 40 | 19 | 0.97 |
### Final result
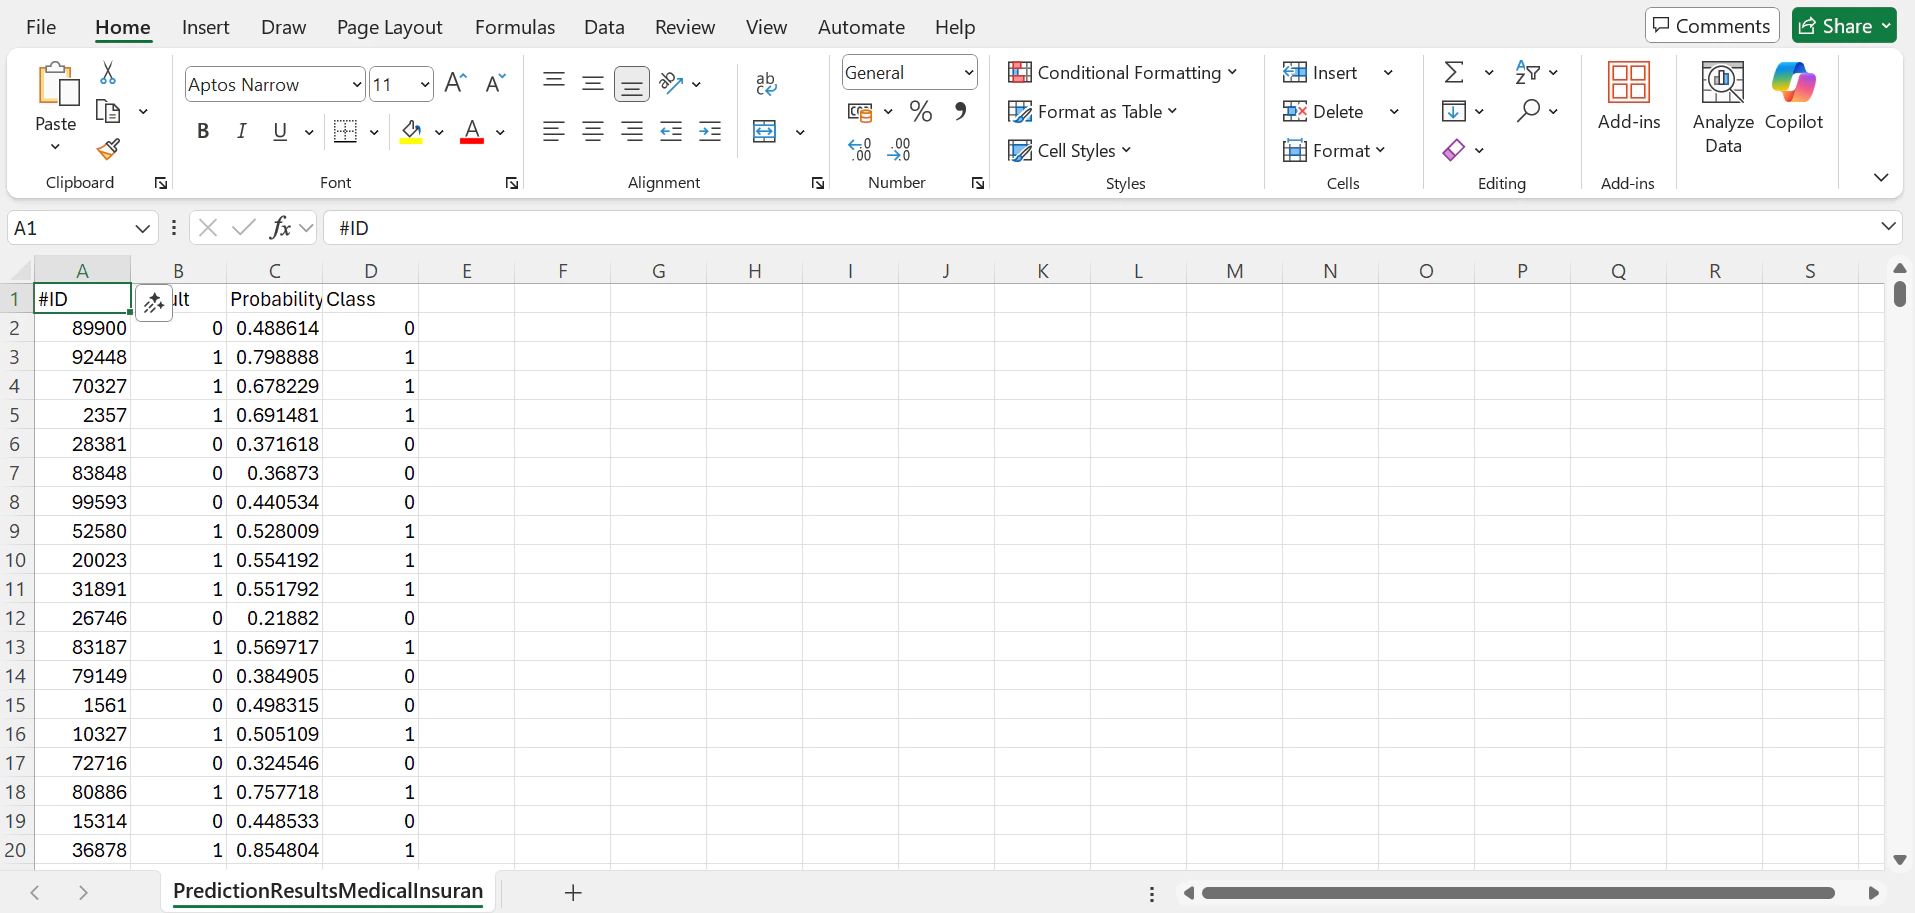
When performing binary classifications or predictions, MathFi.ai platform's underlying proprietary algorithms calculate the probability of certainty for a prediction outcome.
* One label (e.g.`1`) will be selected when the probability is equal or above `0.5`
* and the other one (e.g. `0`) will be selected when the probability is below `0.5`
The closer the value is to `0` or `1`, the more certain is the prediction. The probability is presented in a dedicated column in the prediction result file.
Using this unseen unlabelled data, the resulting CSV looks like this:
 ***
**Build this yourself** — Follow the [Quickstart](/quickstart) to run your first prediction, or go straight to [API Recipes](/developers/api-recipes) to integrate programmatically.
***
**Build this yourself** — Follow the [Quickstart](/quickstart) to run your first prediction, or go straight to [API Recipes](/developers/api-recipes) to integrate programmatically.