

Open it
In the console, go to Datasets and click View details on a dataset. The Data Visualiser is the main part of the panel. It shows only when the dataset has a profile.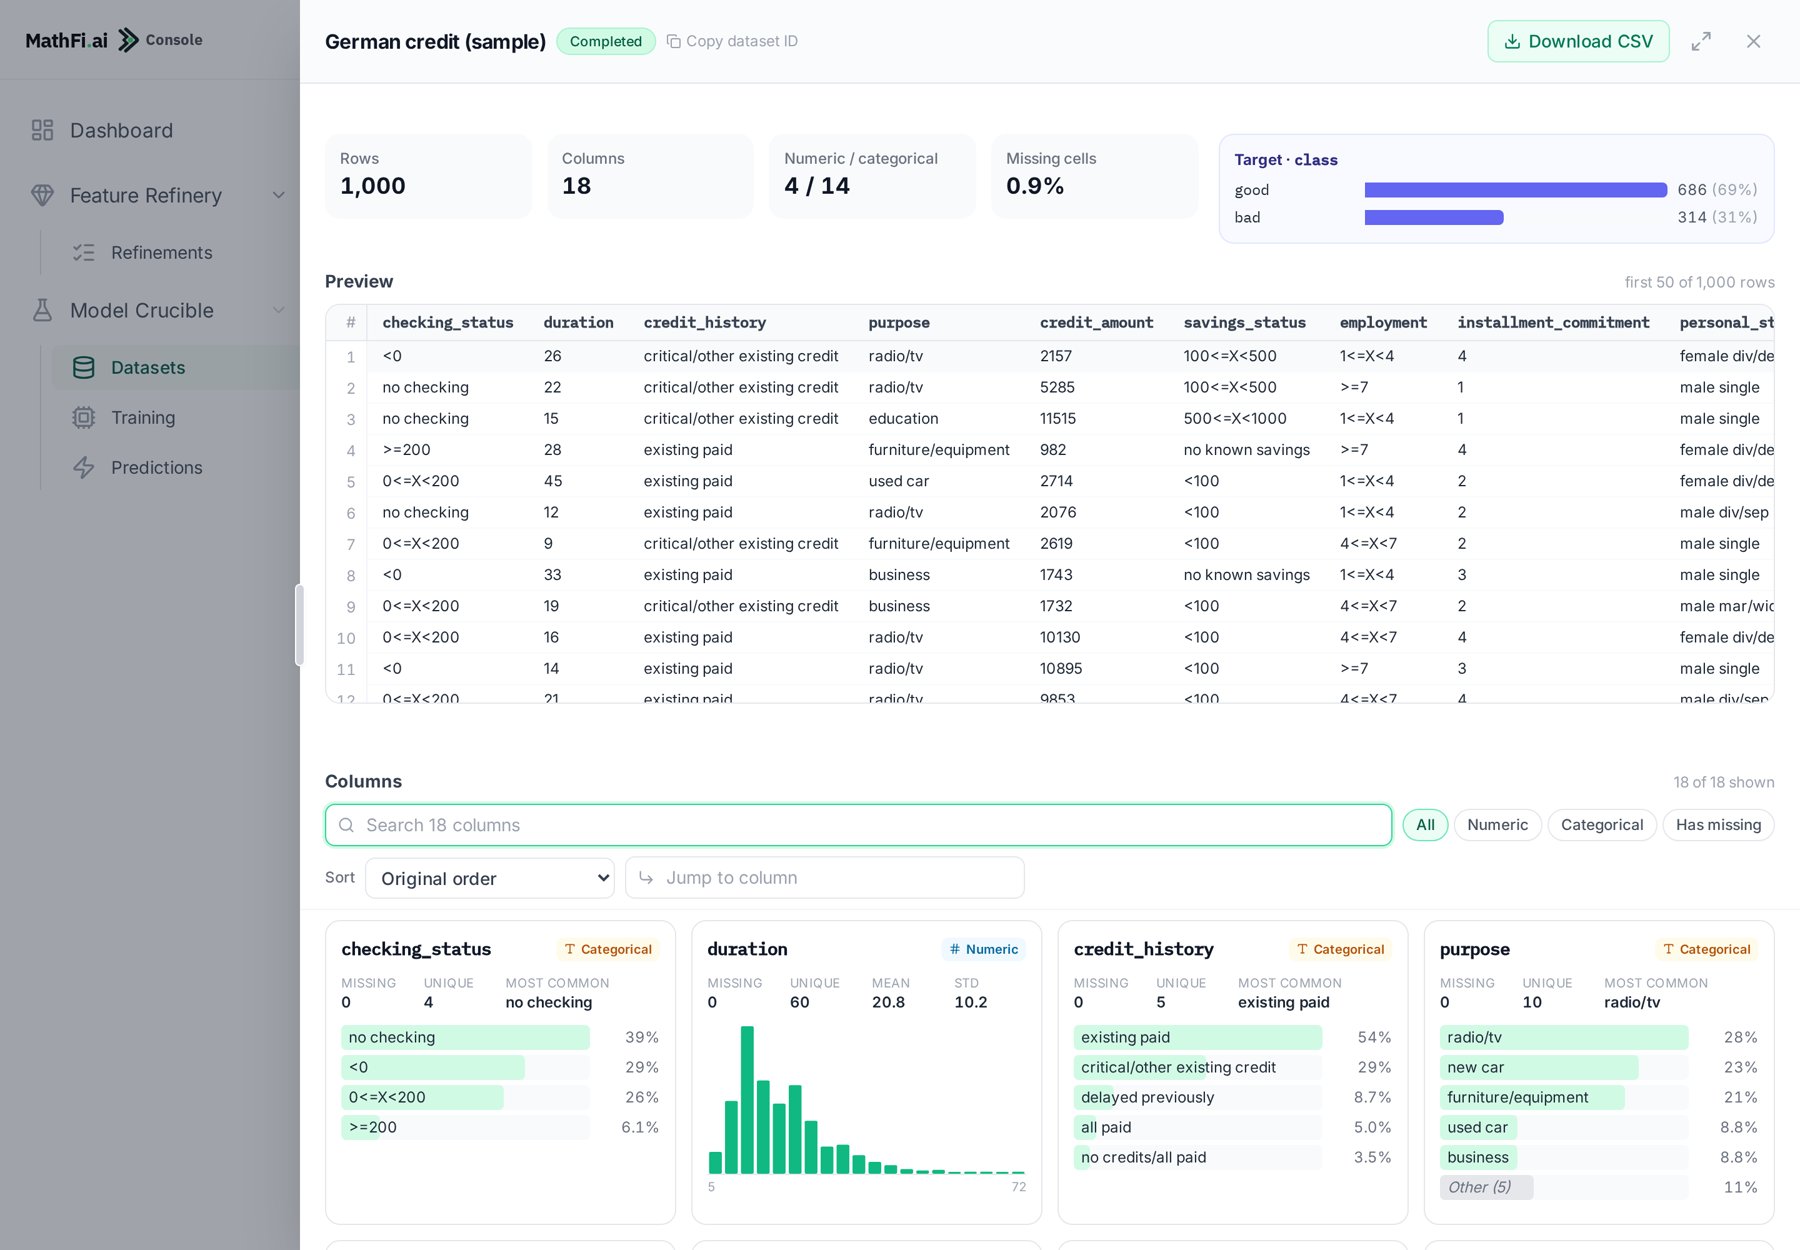
What you see
Above the cards you can search by column name, filter (All, Numeric, Categorical,
Has missing), sort, and jump to a column by name.
Read a column card
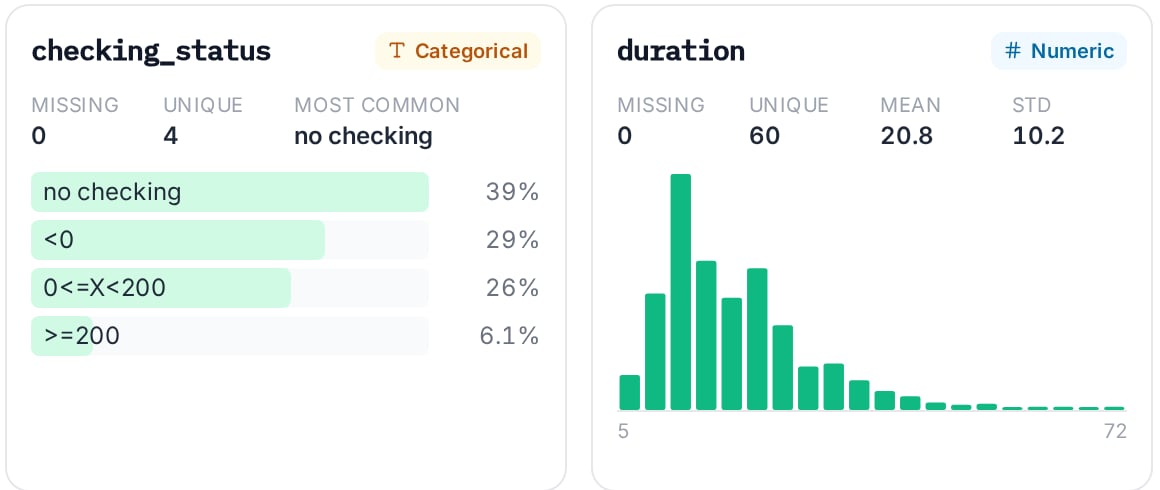
- Numeric column. Mean, Std (standard deviation) and a histogram. The two numbers under the histogram are the lowest and highest value.
- Categorical column. Most common value and a bar for each of the top values, with its share of rows. Values that are not in the top group are added together as Other.
Read the target

Check before you train
- Target. Is it the column you want to predict? Is each class there, with enough rows? Aim for at least 25 labelled rows in the smallest class. See Input data.
- Missing values. Use Has missing to list the columns with gaps. A column that is mostly empty rarely helps a model.
- Types. A column of numbers that shows as categorical, or the reverse, often means a bad value in the file, such as text in a number column.
- Distributions. Look for one value that fills most of a column, and for a long tail of very high values. Decide if they are real or errors.
- Preview. Check that the rows look like the file you meant to upload.
Limits
- The preview shows the first 50 rows, and at most the first 50 columns. The column cards cover every column.
- A dataset with more than about 200 columns can fail to build, so it has no profile. This is a known issue.
- Column limits for each product are on Input data.
- The profile describes the file you uploaded. It does not say which columns will help the model. Feature Refinery does that.